Dark matter
distribution, structure and content in galaxies
Contents
Introduction
My main line of research focuses on the dark matter content and structure in galaxies. I first became interested in dark matter as a research topic (beyond the level of ‘dark matter - that sounds cool!’) as a senior undergraduate when the various parametrizations (NFW, Einasto, …) of dark matter density profiles came up in lecture. I remember wondering how we could possibly have such a detailed understanding of the distribution of something so little understood.
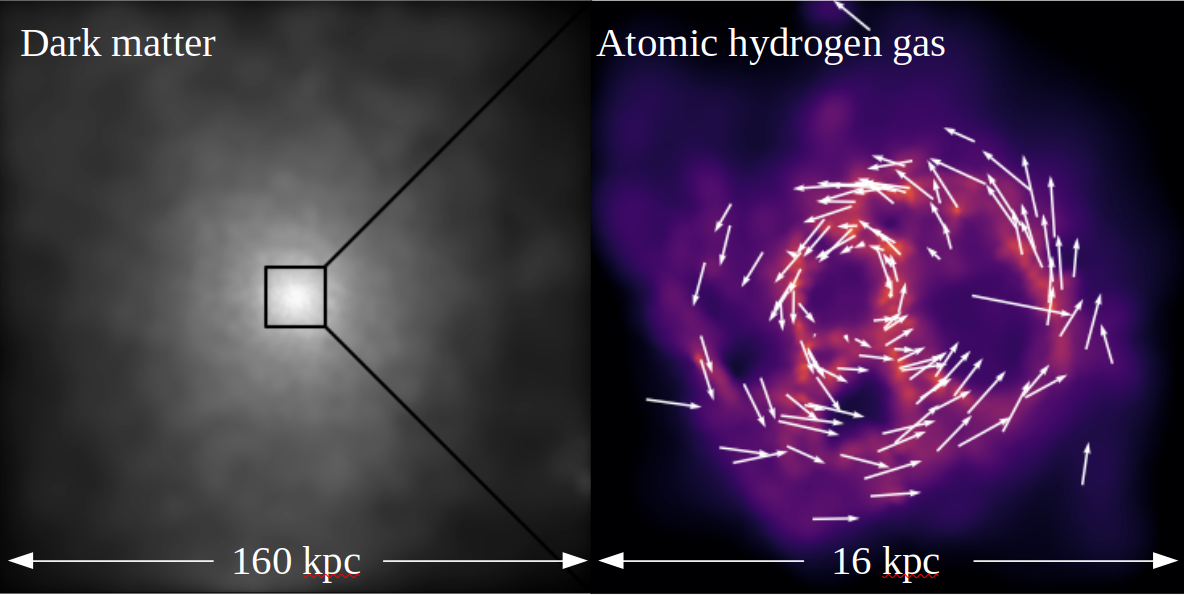
My starting point
I picked up some more background knowledge while doing my MSc in satellite galaxy evolution, enough that once I was accepted to the PhD programme in Victoria and got round to picking a project I proposed to work on the cusp-core problem supervised by Julio Navarro. This ‘problem’ was at the time a statement of the fact that simulations of dark matter evolving under the influence of gravity forms clumps (‘halos’) that get denser towards their centres with a power law slope of about -1, while observations of some galaxies are more consistent with a central region of constant dark matter density (power law slope of 0). The original papers on the subject go back to the mid-nineties, so this was not a newly identified discrepancy. Right around the same time there were some major advances in simulations that soon culminated in the EAGLE simulations and the many associated spinoff projects, including the APOSTLE project (Sawala et al. 2016) that I was heavily involved in. Rotation curves of galaxies from the THINGS and especially the LITTLE THINGS 21‑cm radio surveys surveys were also being published around the same time. This combination of circumstances offered an opportunity to make some new contributions on the subject.
Dwarf galaxies
Dwarf galaxies typically have low stellar and gas densities, low enough that even in there centres the dark matter density can be higher than the visible matter density. Since the dark matter is then the main contributor to the gravitational potential, dwarf galaxies make good targets for study since the dark matter ‘signal’ is high relative to the visible matter ‘noise’.
Rotation curves
One way to measure the dark matter content and distribution in a galaxy is with a rotation curve. In the simplest case, the speed \(v\) of a particle on a circular orbit of radius \(r\) in a spherically-symmetric gravitational potential is related to the mass enclosed within the orbit \(M(<r)\) as \(v(r)=\sqrt{GM(<r)/r}\). If we can measure the orbital speeds of “tracer” particles at a series of radii to build up the rotation curve \(v(r)\), we directly get the mass profile \(M(<r)\). If we subtract off the mass profile of the visible matter (stars, gas) we’re left with the dark matter mass profile.
In realistic galaxies there are some complications:
- the gravitational potential is probably not spherically symmetric (but if the mass budget is dominated by dark matter it might be a reasonable approximation);
- the “tracer” particles are probably not all on circular orbits;
- with the exception of the Milky Way and galaxies in its immediate vicinity, we only measure angular positions and velocities along the line of sight, so we have incomplete information;
- gravity may not be the only force acting.
Nevertheless, in some cases these complications can be modelled or neglected and the general approach still works.
21‑cm, radio or ‘HI’ emission from atomic hydrogen is perhaps the best-known spectral line used to measure rotation curves. The atomic gas has the advantage of often extending well beyond the stellar disc, allowing measurements to larger radii, and the emission physics and radiative transfer are quite simple, making it relatively easy to model.
The ‘diversity’ of dwarf galaxy rotation curves
When I started working on the cusp-core problem the conversation in the literature centred around the slope of the dark matter density profile measured at as small a radius as possible. This has some drawbacks, chiefly that the ‘figure of merit’ (that slope) is very far from what is actually measured (a rotation curve, at least at the first-derived-data-product level). To get from a rotation curve to a density profile first the rotation curve needs to be interpreted as a mass profile (with some uncertainty). Then a derivative needs to be taken to get a density profile, followed by a second derivative to measure its slope. Pushing to the smallest possible radius makes this even more challenging, as does the fact that the dark matter density profile is usually thought of in log-density and log-radius, while the rotation curve is sampled linearly in radius. One of the main goals of my first paper (Oman et al. 2015) on the topic was to propose a formulation of the cusp-core problem that is much more directly anchored in what is actually measured. Comparing the amplitude of the rotation curve at an ‘inner’ and an ‘outer’ radius turns out to do the job, as summarised in Fig. 5 of the paper:
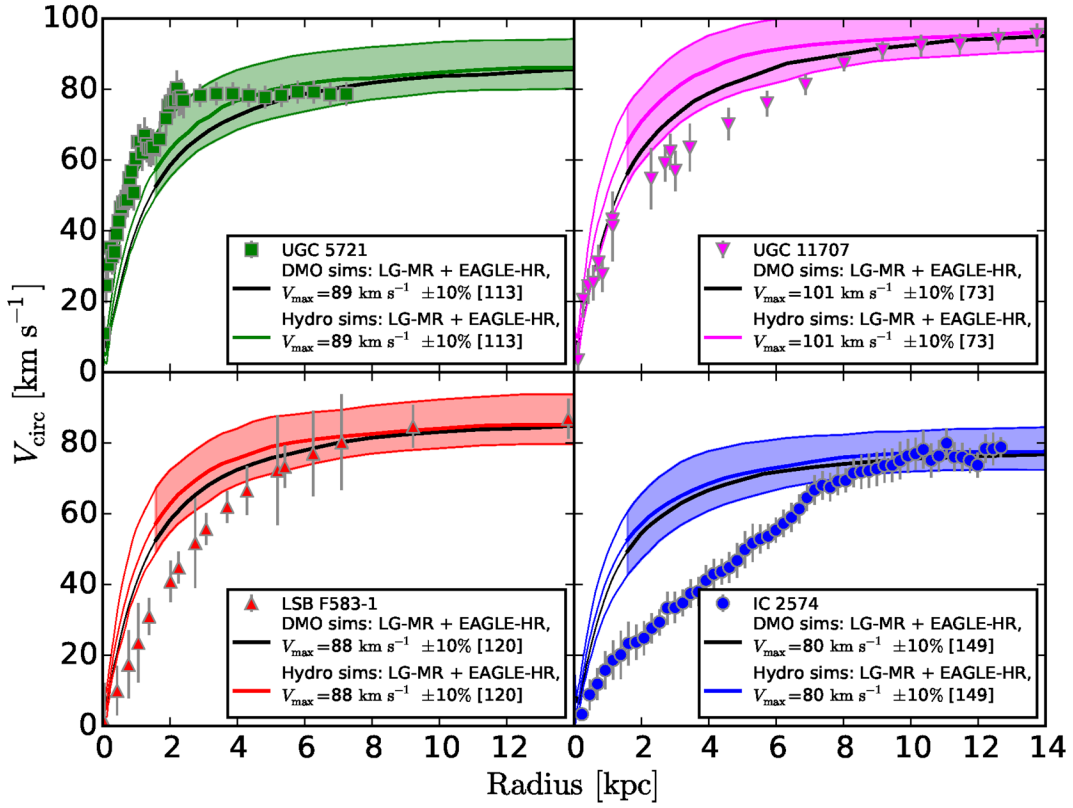
Since the four galaxies have a fixed
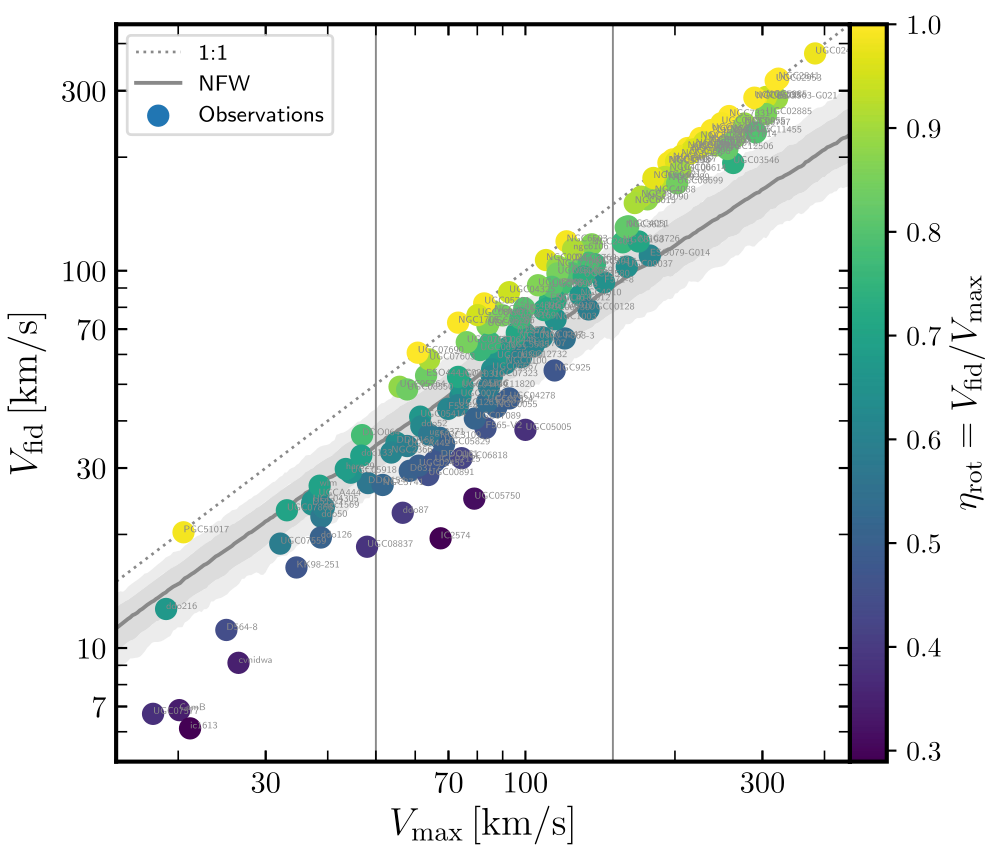
The ‘diversity’ from the title of the paper refers to the vertical scatter for galaxies with Vmax between about 50 and
Explaining the diversity in rotation curve shapes
Another point that we (Oman et al. 2015) emphasized is that there are a limited number of ways that the diversity in low-mass galaxy rotation curve shapes can be explained. The comprehensive list has only 4 items:
- Dark matter could be re-distributed away from a cuspy distribution by the physics of normal matter, such as by the gravitational influence of gas flows driven by repeated cycles of gas cooling and supernova-driven winds.
- Dark matter could be re-distributed away from a cuspy distribution by the physics of dark matter, such as by a collisional interaction between pairs of dark matter particles.
- Our interpretation of the measurements may be incorrect because we have assumed the wrong gravitational force law (i.e. we could consider alternatives such as modified Newtonian dynamics).
- Our interpretation of the measurements may be incorrect because we have made flawed assumptions in modelling the data.
Much of my work since has been focused on the last point as a possible explanation. I am at this point convinced that there are systematic errors in the modelling and interpretation of the rotation of low-mass galaxies at a level that cannot be ignored. That these would be enough to completely resolve the cusp-core debate by making every galaxy consistent with hosting a dark matter cusp if they were corrected, however, seems like a stretch. My view is therefore that we need to clean up the modelling to know what we should be aiming for more broadly with galaxy formation models (like: how much do we need stellar feedback to reshape the dark matter distribution in galaxies?).
I think that much of the systematic error budget in modelling the gas kinematics in low-mass galaxies can be assigned to mismatches between the assumptions made in the models and reality. A straightforward example is that the classical ‘tilted-ring’ approach assumes that at any given radius the gas is axisymmetric, with no modulation in velocity around the ring. This is essentially guaranteed to be false at some level, and our work (Oman et al. 2019) with simulated galaxies suggests that gas in roughly elliptical orbits (rather than circular) could realistically drive a lot of the scatter in rotation curve shapes. A clear example of such elongated orbits is illustrated in that paper’s Fig. 6:
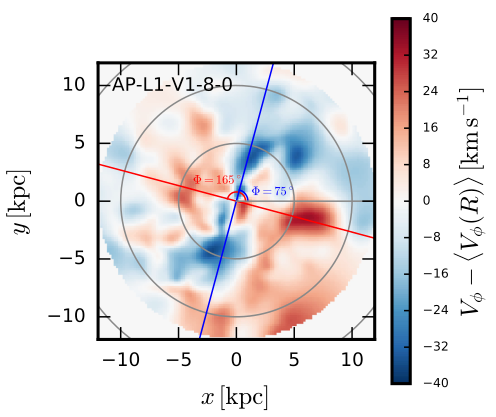
The elongation of the gas orbits is probably driven by an elongated shape of the dark matter halos in which they are embedded (Marasco et al. 2018). A similar argument applies to the assumption that the gas disc is geometrically thin, when in fact it is likely thick enough that any given sight line through an inclined disc passes through several of the rings that it is decomposed into in a model.
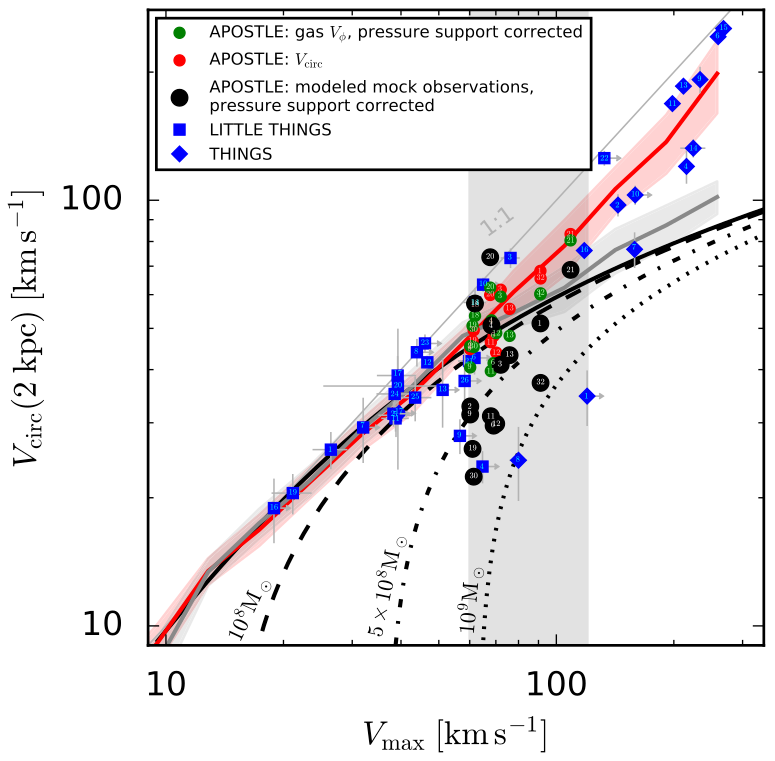
We (Oman et al. 2019) summarized the cumulative effects of gas being perturbed so that it doesn’t quite rotate at the circular velocity (Vϕ compared to Vcirc) and then of systematic errors in modelling the gas kinematics (modeled mock observations compared to Vϕ) in the same space of inner rotation velocity versus maximum rotation velocity explained above. The initially tightly clustered circular velocity curve shapes (from Vcirc, red points) end up looking much more like the observed distribution (blue points) once they are “observed” and modelled (black points) in the same way as the observations (from the paper’s Fig. 9):
Further hints to the origin of the diversity in rotation curve shapes
The next significant development that I was involved in (Santos-Santos et al. 2020) was the development of a somewhat compressed version of the rotation curve shape plot (Vfid vs Vmax or V(2 kpc) vs Vmax) so that information about the dynamical importance of the dark matter could also be included. The y-axis shows a parameter ηrot=Vfid/Vmax that summarises how steeply-rising the rotation curve is, while the x-axis shows ηbar, that is approximately equal to the ratio of baryonic-to-total mass in the central regions of a galaxy. (This version taken from Fig. 4 of the paper.)
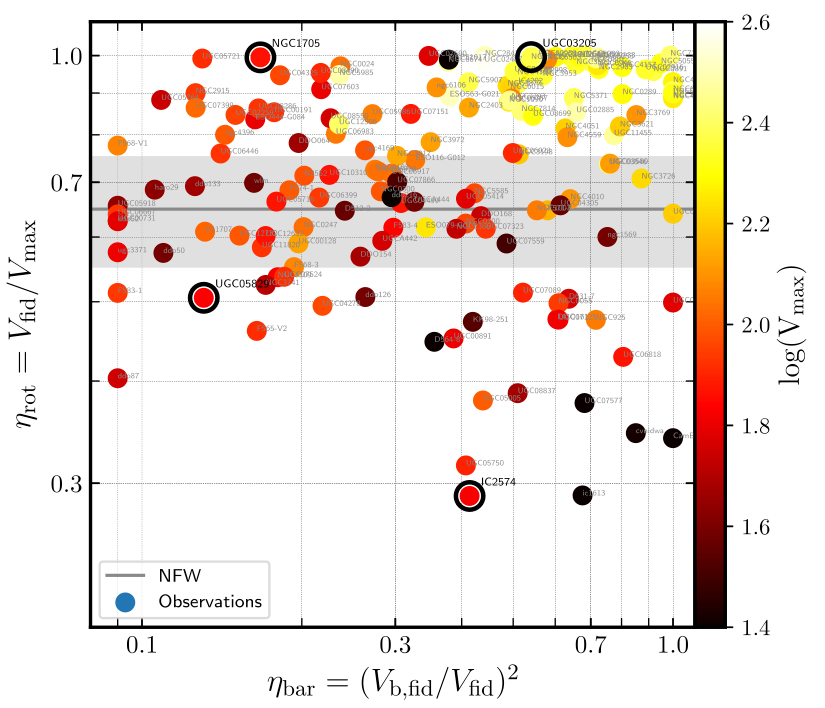
The distribution of low-mass galaxies (orange to black on the colour bar) in this space turns out to be very informative. The trend runs from the upper left of the figure to the lower right, with plenty of scatter. In words, this means that the most centrally ‘dark matter-dominated’ galaxies have the steeply-rising rotation curves associated with dark matter cusps, while centrally baryon-dominated galaxies have slowly-rising rotation curves associated with dark matter cores. In some contexts this could be intuitive. For example, if we hypothesize that cores are created by re-distribution of dark matter following episodes supernova-driven winds, then it makes sense that having a high enough baryon density in the centre of the galaxy to have a significant dynamical influence on the dark matter would be a pre-requisite. As we went through in detail in the paper, however, no simulation or similar model at the time could satisfactorily reproduce the observed trend (and to my knowledge this hasn’t changed since, with the possible exception of the New Horizon simulations). It turns out, however, that the types of systematic errors that come up when trying to model the gas kinematics in these kinds of galaxies, like those due to non-circular gas orbits mentioned above, naturally lead to the observed trend and scatter. To me this is another hint that such modelling errors are the leading effect that we’re seeing in observational studies, but doesn’t rule out that there might be signatures of interesting physics like cores created by supernova feedback or dark matter scattering interactions to be found once the models are cleaned up.
Supernova feedback-driven dark matter cores as an explanation
My MPhys student Finn Roper’s project (Roper et al. 2023) looked at whether once simulated galaxies are observed at 21‑cm wavelengths and modelled analogously to what is done with real galaxies we could still tell the difference between galaxies with a dark matter cusp and others with dark matter cores. The ηrot-ηbar figure introduced above makes a good diagnostic for this (taken from the paper’s Fig. 11):
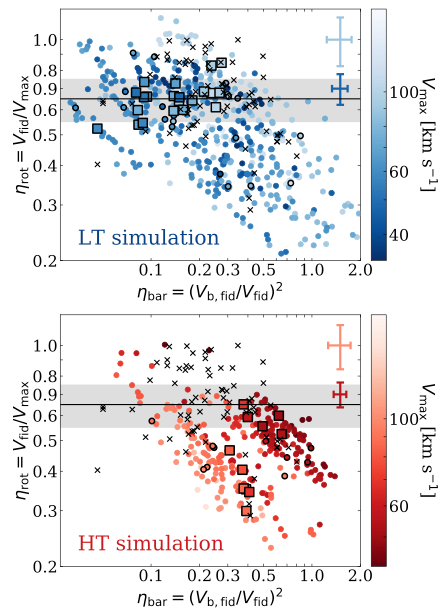
The galaxies in the upper panel all have dark matter cusps, while most of those in the lower panel have cores formed by repeated cycles of gas accretion and ejection by supernova winds. This manifests as a vertical offset between the square markers, which reflect the intrinsic matter distribution in the galaxies. There’s also a horizontal offset, showing that the galaxies that form cores tend to have somewhat higher baryon-to-dark matter ratios in their centres. This turns out to be a combination of less dark matter (due to the core) and more baryons, particularly in the portion of the cycle just before a burst of supernovae. Once the galaxies are observed (24 observations per galaxy, shown with the small points) in both cases the measurements scatter significantly along the upper left-to-lower right diagonal. There’s a preference to scatter towards the bottom right because of errors induced by the thickness of the discs; this is less pronounced in the cored galaxies where the discs tend to be thinner. In the end the two distribution overlap substantially. If I squint at the figure for long enough, maybe the galaxies with dark matter cusps resemble the observations (black crosses) slightly more than the galaxies with cores, but there are a lot of sample selection issues to worry about before trying to make that kind of claim in a convincing way. The way that we got galaxies to make dark matter cores also involves quite a blunt instrument - we just turned up the gas density threshold for star formation in the EAGLE galaxy formation model. There’s definitely some room for further work with other models that produce galaxies with dark matter cores without arbitrarily changing model parameters, or perhaps to vary a model to cover both cases but re-calibrate it so that the comparison is between the ‘best’ model in both scenarios. Nonetheless, this work highlights again that modelling uncertainties are really the first hurdle to overcome when interpreting observations of these kinds of galaxies to get at their dark matter content and distribution.